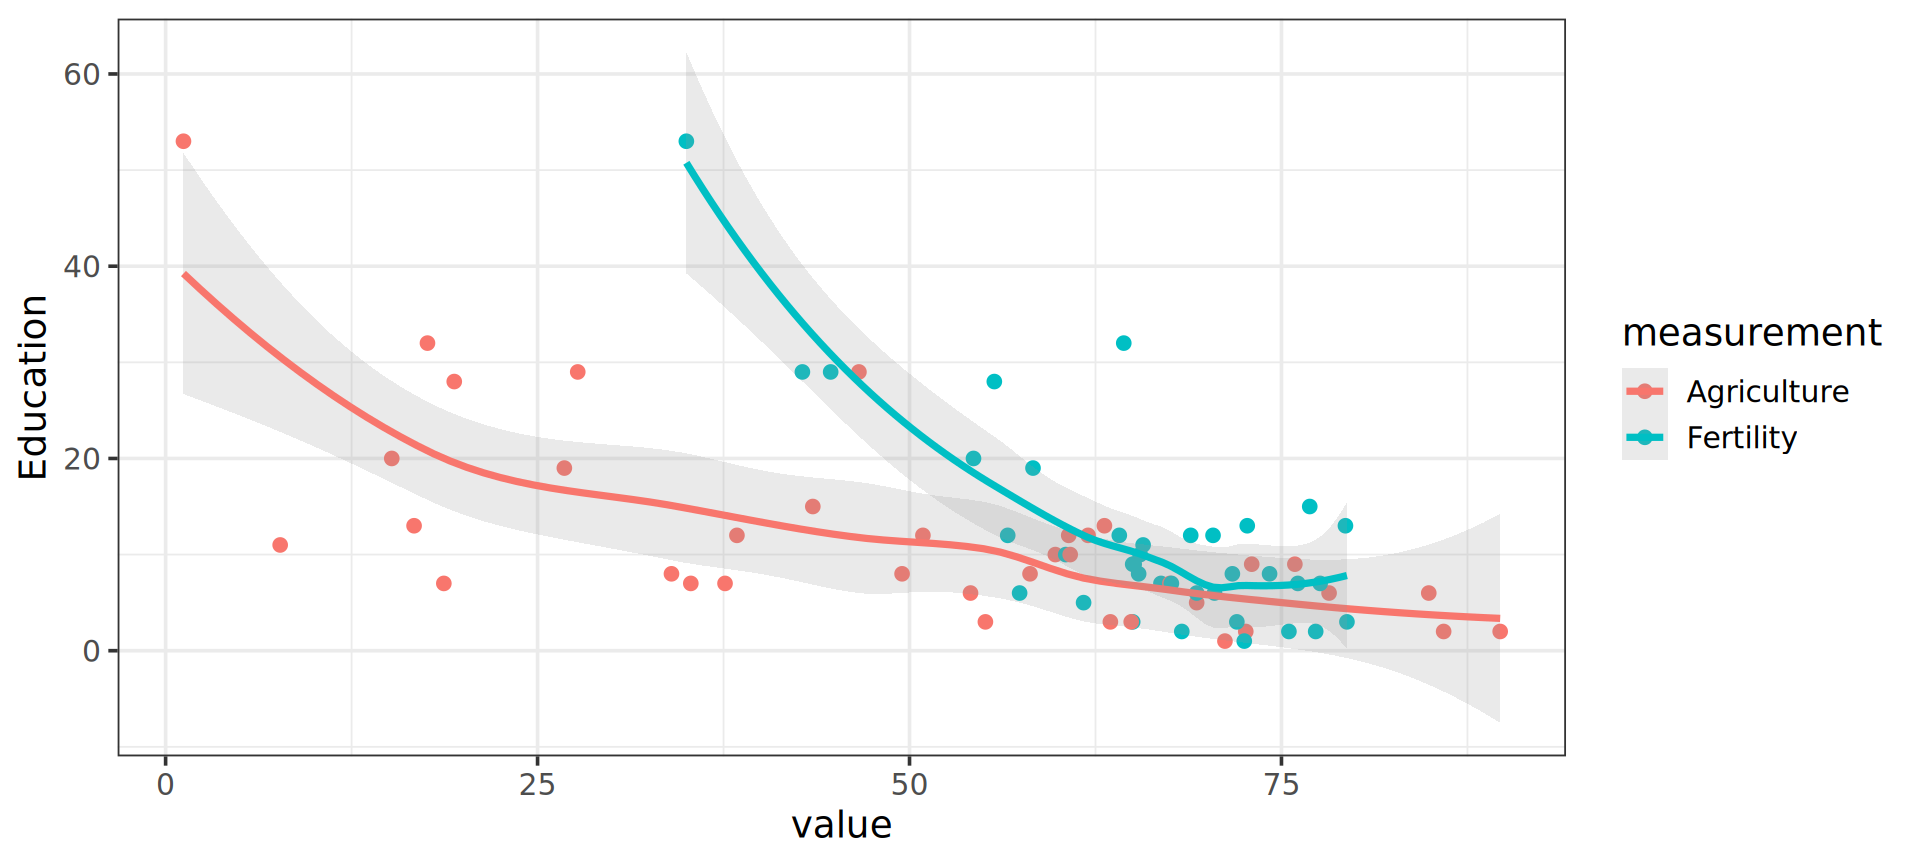
library(tidyverse)
read_csv("https://biostat2.uni.lu/practicals/data/swiss.csv",
         show_col_types = FALSE) |>
  filter_out(Fertility > 80) |>
  pivot_longer(cols = c(Fertility, Agriculture),
               names_to = "measurement",
               values_to = "value") |>
  ggplot(aes(x = value, y = Education, colour = measurement)) +
  geom_point() +
  geom_smooth(method = "loess", formula = "y ~ x", alpha = 0.2) +
  theme_bw(14)